Bayleys Real Estate Ltd
Residential
Commercial
Rural
News and Editorial
Auctions
Bayleys Real Estate Ltd

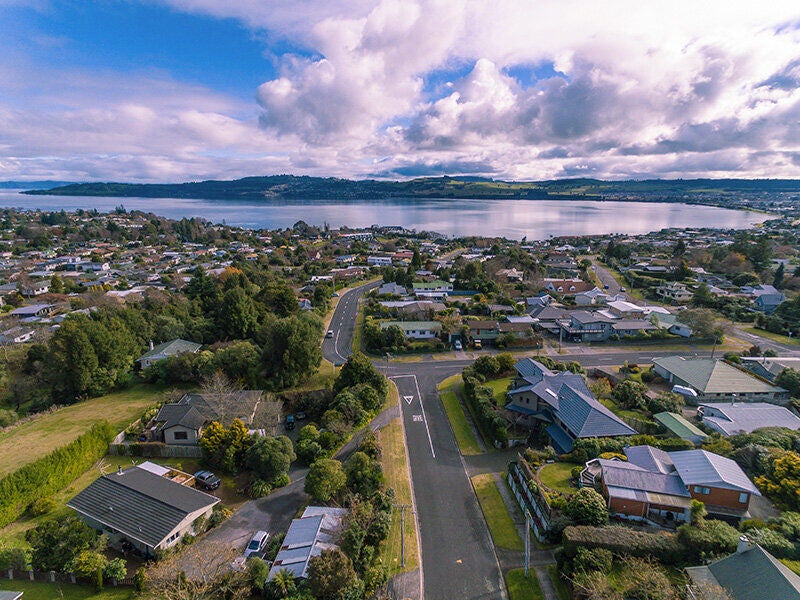
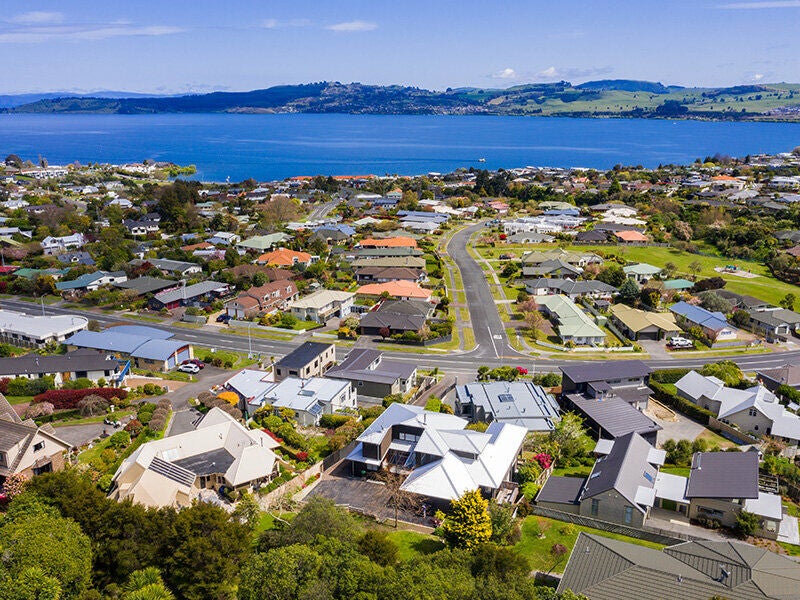
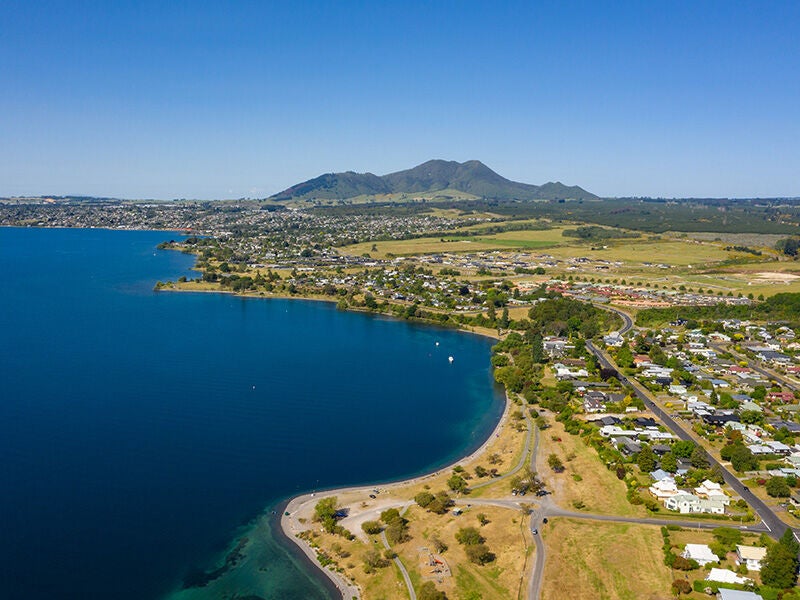
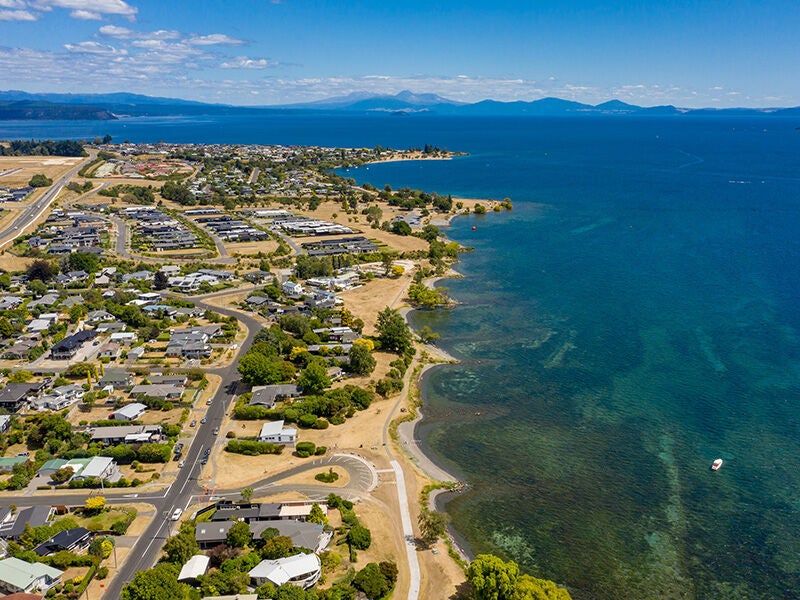
The Taupō real estate market report

Slide 1 of 3

Want to know where our buyers are coming from? See the breakdown by region in a graphic below.

Want to see the average house price in each Taupō suburb? Or are you just curious to see how your suburb is doing right now?

See how property is performing as a whole in Taupō, even taking a look back at how the past month compares to the same month last year.

Where do our buyers come from?

  • Local 52%

  • Auckland 16%

  • Bay of Plenty 14%

  • Manawatu 4%

  • Wellington 4%

  • Waikato 3%

  • Hawke's Bay 4%

  • Other 3%

  • South Island 1%

  • Taranaki 1%

*Period: January 2022 to December 2022
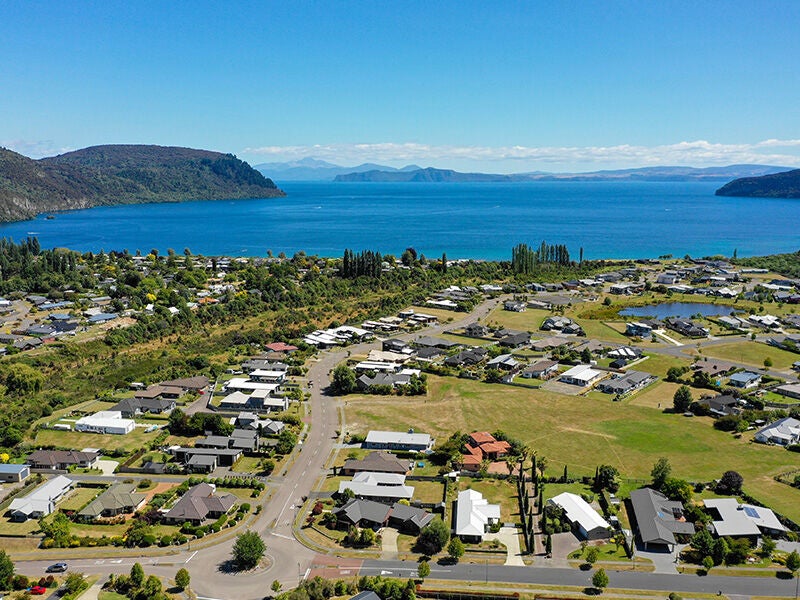
September 2023

The arrival of Spring saw September yield 45 residential dwelling sales, very much in line with recent monthly trends.

The Annual Moving Median rose slightly from the previous month to stand at $835,541 on a Monthly Median of $850,000, the latter increasing by some $90,000 on the August figure.

Also worthy of note is the decrease in Annual Moving Median, where the trend is reverting toward positive growth, albeit on a gradual basis.

The local market was further augmented by some 15 section sales, resulting in an Annual Moving Median of $478,913 from a Monthly Median of $600,000.

As we write, a new government will be sworn- in over the next month or so, and so again watch this space for an uptake in enquiry and confirmed sales.

(Source REINZ)

62 sold

Number of Residential houses sold in the last month

5.37% decrease

Average sale price increased. Annual moving median

August 2022 - August 2023

36 days

Median days on the market (houses incl. Turangi)

Suburb Profiles

Acacia+Bay.jpg

Acacia Bay

Number of houses sold 17

Average house sale price $1,085,912

Number of sections sold 3

Average section sale price $410,000

Nukuhau.jpg

Nukuhau

Number of houses sold 29

Average house sale price $818,086

Number of sections sold 8

Average section sale price $803,250

Rangatira+Park.jpg

Rangatira Park

Number of houses sold 19

Average house sale price $988,000

Number of sections sold -

Average section sale price -

TaupoCentral.jpg

Taupo Central

Number of houses sold 72

Average house sale price $627,893

Number of sections sold 3

Average section sale price $563,333

Hilltop.jpg

Hilltop

Number of houses sold 29

Average house sale price $928,252

Number of sections sold 1

Average section sale price $305,000

Tauhara.jpg

Tauhara

Number of houses sold 11

Average house sale price $569,090

Number of sections sold 1

Average section sale price $343,000

Richmond+Heights.jpg

Richmond Heights

Number of houses sold 25

Average house sale price $773,332

Number of sections sold -

Average section sale price -

TwoMileBay.jpg

Two Mile Bay

Number of houses sold 3

Average house sale price $645,000

Number of sections sold 2

Average section sale price 800,000

Waipahihi.jpg

Waipahihi

Number of houses sold 17

Average house sale price $1,116,088

Number of sections sold -

Average section sale price $-

Wharewaka.jpg

Wharewaka

Number of houses sold 18

Average house sale price $1,142,622

Number of sections sold 58

Average section sale price $428,218

RainbowPoint.jpg

Rainbow Point

Number of houses sold 2

Average house sale price $945,000

Number of sections sold -

Average section sale price -

Kinloch.jpg

Kinloch

Number of houses sold 24

Average house sale price $1,145,104

Number of sections sold 44

Average section sale price $454,000

Westermanos-0193.jpg

Mangakino

Number of houses sold 2

Average house sale price $290,000

Number of sections sold -

Average section sale price -

Westermanos-0573.jpg

Waitahanui

Number of houses sold 1

Average house sale price $1,800,000

Number of sections sold -

Average section sale price -